In-Depth Guide for Graphs & Tables Questions, Most Often Encountered in Numerical Reasoning Tests
Numerical reasoning tests, especially numerical critical tests, introduce a large family of graphs and tables for representing numerical data.
Here is a helpful review of some graphs and tables that applicants always seem to have problems with.
What Are Graphs and Tables
Graphs and tables are a common measure of presenting large amounts of data in a graphical, easy-to-understand way.
Since interpreting and analyzing graphs and tables is a task which requires both mathematical and reasoning skills, they are a favourite type of question in numerical reasoning tests.
Graphs
graphs are used in numerical reasoning tests to convey complex data, but more often than not they are made to pose as complex while hiding the specific piece of information you need to answer the question.
The most important aspect of learning to solve graph question is knowing how disregard the noise and find the fastest course to what you need to verify the answer.
Line Graph
That is the simplest, most common type of graph. It normally presents data on two axes – horizontal and vertical. For each element on the horizontal axis, a value is given in the vertical axis. Usually, line graphs are used to show changes in a single element over time
Look at the example below:
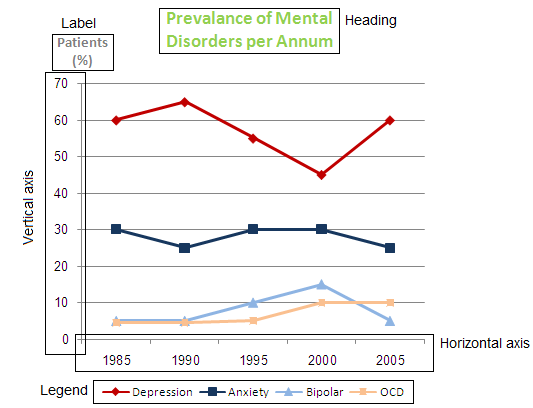
The graph contains the following components:
- Heading – the name of the graph (duh). Will usually reflect the axes. In our case: Prevalence of mental disorders (vertical axis) per Annum (horizontal axis).
- The vertical axis – this is the data the graph is intended to show. In our case, it's the prevalence of mental disorders.
- Horizontal axis – that is the graph's basis of comparison (in 95% of the cases you'll encounter, it'll be time). More generally, it presents the continuum along which the data changes. In our case, it's years.
- Labels – the names of the axes. These do not always appear, and you will need to understand the meaning of the axes from the heading or context.
- Legend – appears when more than one line appears on the same chart.
Line Graph - Sample Question

Which of the following years had the lowest percentage of people who were not accepted?
Bar Graph
A bar graph presents data by categories in bars proportional to their respective value. Unlike a line graph, that has an element of continuum (like time), the categories in a bar graph are separated.

A bar graph may be vertical or horizontal. The vertical and category axes will naturally switch places:
| Vertical | Horizontal |
 |
 |
Bar Graph - Sample Question
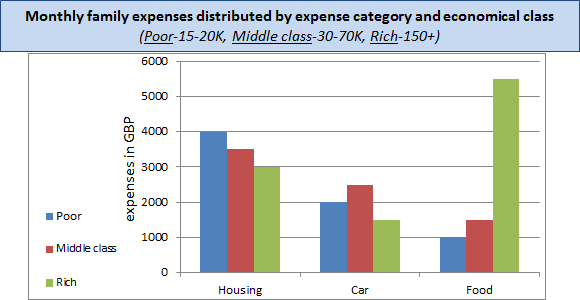
Rich families spend ___________ of money on food as poor and middle class families combined.
Stacked Bar Graph
A stacked bar graph is similar to a bar graph, only that different data elements are presented on the same bar. These graphs are useful in visually and clearly revealing differences between categories or over time.
For instance, look at the graph below:

It is visually very clear that the sum of subsidiaries has declined drastically from 2007 to 2008, yet its share of the total investment has stayed rather similar (actually, it even grew slightly).
We Help Over 70,000 People Every Year Improve Their Score - Fast
Pie Chart
Pie charts are used to present proportions of various elements. These elements can be measured in percent, money, numerical value (1,2,3…) or any other measurement.
The pie chart is one of the simplest graphs, and normally contains only 3 parts:
- Heading – we've already told you what that is…
- Legend – shows the distribution of colors on the chart
- The total amount to which the pie chart refers (if the chart presents percentages, well, you can guess for yourself what it'll be).

Pie Graph - Sample Question

What is the percentage of clubs income from the total income?
Area Graph
Although they seem intimidating at first glance, area graphs simply combine the features of line graphs and stacked bar graphs. Each colored segment represents a series of data. Like bar graphs, area graphs may be 2D or 3D, vertical or horizontal.
There are two types of area graphs: stacked and non-stacked:
- In a non-stacked graph, each segment, representing one data series, overrides parts of another data series.
- In a stacked graph, each segment stands on its own and there is no override between series.
To illustrate, look at the graph below, in the red series in 2008:

In the non-stacked graph, the value of the red series in 2008 is 12 (all the way from the bottom). In the stacked graph, it is 2 = 12 – 10 (from the top of the previous series).
This type of area graph shows the relationship of the part to the whole, and is useful if you want to examine a cumulative effect.
Since distinguishing stacked from non-stacked 2D area graphs can be quite difficult, you will usually be provided with additional information that will allow you to conclude the graph type.
Radar Graphs
In these graphs, scale value grid lines are surrounding a central zero point. The numerical values can be mentioned once on one vertex, or, alternatively, each vertex can have its own values.
In this instance, in 2007, operational profit was £100,000,000.

HLC/OHLC Graphs
High-low-close or open-high-low-close graphs are used for displaying daily fluctuations of stock prices. It is important to be familiar with the legend conventions of these graphs, which are quite simple.
In the HLC graph below, high values are marked by a triangle that intersects with the grid line, the low price is the bottom part of the line, and the close value can be inferred in this case only through a table which should accompany the graph.

In the OHLC graph below, the vertical rectangle marks the open/close values; when the box is dark, the open value was higher than the close value.
When the box is light, the open value was lower than the close value. The vertical line's edges represent the high/low values.

These graphs sometimes use different notations for marking the OHLC values, and can also include the volumes of stocks traded per day.
Tables
There are numerous types of tables that display numerical data. Numerical reasoning tests tend to contain a mixture of table themes such as population demographics, balance sheets, results of telemarketing surveys, etc.
Since the administrators' intention is to see how quickly you can analyse shifting sets of data, here are some popular tables used at numerical reasoning tests to further grow your knowledge in the area.
We advise you to go through these examples before starting to practise.
Let's look at some examples of frequently encountered statistical information tables:
Statistical Information Tables

The above table is quite simple. Numerical figures do not represent millions or thousands, rather absolute numbers. Furthermore, there are no columns that include percentages or ratios.
After using the orientation test - setting your eyes at a specific point within the data range/making sure you can understand the context - it is clear that the 'Total' column is the sum of 'All countries' + 'UK citizens'.
Here is another popular table, presenting demographic statistics and combining various types of data (area, numbers and rates):

Statistical Information Tables - Sample Question

Which brewery produced the least in 2004?
Experiment Table
The following table displays the results of an experiment. It is packed with figures, and the asterisks would probably be crucial for answering certain questions.
Experiment Table - Sample Question

Which of the following sub-groups achieved the highest average score at experiment 2?
Financial Report Tables
In these tables you would probably be asked to calculate some popular financial ratios - profit margins, growth rates, return on equity, etc.

Many of the leading financial services and consulting companies use numerical reasoning tests as part of their recruitment process.
Financial report tables are the most common type of table used in such tests. Familiarizing yourself with numerical tables is an essential part of the preparation for getting through the assessment tests.
Everyday Tables
Simpler cases might include the tables we come across with on a daily basis, e.g. nutritional values of foods, bills, travel expenses reports, etc.

Practise for Any Numerical Reasoning Test with Our Experts
Our practice pack contains all the subjects that typically appear on numerical reasoning exams, so even if you don't know your exam, you are covered!

Fit for all levels
Regardless of how long it's been since you've done maths, the pack will get you on track.

Comprehensive Explanations
Each question comes with a full, detailed explanation of the answer.
Quality Ensured
When purchasing the pack, you get access to our customer service to ensure satisfaction.
Available for only £39, you can ensure the high score you deserve and unlock your potential
- 13 tables and graphs tests
- 9 word-problem tests
- 17 numerical and question drills
- 11 video tutorials and 5 study guides
More Free Practice
We at JobTestPrep find the assessment tests world highly diverse and fascinating. If you are looking to deepen your knowledge in the aptitude tests world, or you want some extra practice before your test, we've got you covered!
Check out these fantastic free practice tests (all are completely free):
Free Aptitude Test | Free Psychometric Test | Free Numerical Reasoning Test | Free Verbal Reasoning Test | Free Cognitive Test | Free Critical Thinking Test | Free Abstract Reasoning Test | Free Spatial Reasoning Tets | Free Personality Test | Free Inductive Test | Free Mechanical Reasoning Test
JobTestPrep provides comprehensive numerical reasoning test practice and company-specific tailored PrepPacks, such as the Macquarie psychometric assessment preparation, as well as numerical reasoning practice specific to different test providers, for example, Cubiks test preparation.
Read more about numerical reasoning tests, numerical reasoning test tips and basic maths test, or take a free SHL practice test.
Create Your Custom Assessment Prep Kit
Job-seeking can be a long and frustrating process, often taking months and involving numerous pre-employment tests and interviews. To guide you through it, we offer a Premium Membership.
Choose 3 Preparation Packs at 50% discount for 1, 3, or 6 months.


